2 MIN READ
Home Sales Hit Historic Low
- Self Storage Industry

4 MIN READ
March 13, 2024
The primary risk facing self storage development is the potential oversaturation with new facilities opening in tandem in the same trade area. A surge in competition during the initial lease-up phase can significantly lengthen the term and potentially the success of any facility.
When a new self storage facility launches, it typically offers discounted rates to attract customers. For instance, while the market rate for a 10x10 unit might be $150, a new operator might initially offer units at $110 to fill up quickly. This strategy works well when developers anticipate a gradual lease-up process over two to three years to reach market rates. When multiple facilities enter the market simultaneously, however, they compete for the same pool of customers.
This competition leads to a downward price spiral as facilities continually undercut each other to attract tenants. This phenomenon mirrors the dynamics seen in gas stations directly across the street from one another. If all is equal, customers will go to the station with lower prices, which is why competitors are normally within a few cents of each other.

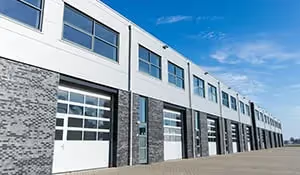
A trio of self storage facilities on the same block in Miami, FL
Once the downward spiral begins, restoring a stable market can take years. Developers fail to meet their projections, and in some instances, they may struggle to generate enough income to cover their loans, potentially leading to foreclosure. Recently, this dynamic has resulted in several stressed storage assets emerging across the country.
As an example of rapid oversaturation, La Vergne, TN, a southeast suburb of Nashville, experienced significant supply growth over a two-year period. La Vergne saw 17% supply growth in 2022 and an additional 13% in 2023. By comparison, the Nashville macro market saw 1.1% cumulative supply growth in 2022 and 2.7% in 2023.

Green dots show the recently delivered supply, and red dots indicate prior supply.
Supply growth of over 20% typically triggers a market shock. The sudden addition of four storage facilities within 16 months is exceptionally high, even for a growing market like La Vergne.
Analyzing rental rates in the submarket over the past two years highlights this issue further. During the peak demand in the summer of 2022, rates surpassed the overall Nashville levels. As demand began to taper off, however, the two facilities in lease-up had to attract customers by reducing rates, following a similar trend to the overall market.
Since then, two more facilities have been delivered, exacerbating the disparity. Currently, the overall Nashville rates are 42% higher than those in La Vergne. This trend has yet to reverse, with Nashville rates only experiencing a slight decrease of -4% year over year (YoY), while La Vergne continues to face significant declines at -21% YoY. The red arrows on the graph below indicate when a new facility was delivered in La Vergne.

To tackle this issue, DXD conducts a thorough analysis to identify potential barriers to entry for each investment opportunity and assess the expected new supply. In a market with low barriers to entry and high population growth, supply can easily exceed demand. Many inexperienced developers lack this foresight; they rely solely on self storage feasibility studies, which typically focus on the current market conditions without an understanding of future dynamics.
At the end of the day, when substantial supply is added to a market, and demand does not increase at the same level, you get La Vergne, TN.
LOAD MORE
4 MIN READ
4 MIN READ